
By: Andy Loignon
Teams are often brought together to achieve things that an individual couldn’t accomplish on their own. Thus, we might expect that bringing together the best talent within a group should yield the most effective teams. However, there are countless examples of teams of all-star failing to reach their potential.i For example, consider the 2004 Men’s Olympic Basketball Team. This team had a roster full of the best professional basketball players in the world, a top-tier coaching staff, and abundant resources (e.g., training facilities). Yet, rather than bringing home a gold medal, the team barely earned a bronze and fell far short of expectations set by earlier Dream Teams. In this blog post, I discuss how teams in today’s organizations can avoid a similar fate by (1) thinking carefully about performance in teams, (2) identifying star performers, and (3) aligning these star performers with the rest of the group.
(Re)Considering Performance in Teams?
To begin, it can be helpful to first consider where contributions are coming from within the group. With that in mind, take a moment to think of the members of your team or department. For each team member, consider their performance over the past 3 months. You might ask yourself questions like:
- Has this person been reaching their objectives?
- What is the quality of their work?
- Have deadlines been met or missed?
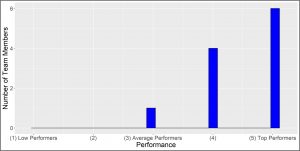
Now on a piece of paper, jot down their initials and give each person a rating from 1 to 5. For the current exercise:
- 5 reflects Top Performers: Member who contribute the most to the team’s performance.
- 3 reflects Average Performers: Members who adequately complete their assignments and responsibilities.
- 1 reflects Low Performers: Member who may be struggling to complete their tasks, meet deadlines, or contribute to the group.
Chances are, if we took these ratings and plotted them, they would resemble one of the two figures below. The figure on top suggests that most people on your team are meeting expectations and only a small number are struggling or excelling. The figure on the bottom resembles “stair steps.” In this situation, nearly all your team members are top performers and only are few would be considered average.

Star Performers and Objective Performance
Although these patterns are quite common for subjective ratings of performance,ii objective measures often tell a different story. That is, if we look at measures of performance that are based on archival data rather than evaluations or ratings, we are more likely to find there are star performers within organizations. Star performers are employees who account for a disproportionate amount of productivity relative to their peers.iii In fact, researchers have examined performance data across 227 distinct settings and consistently found a small number of individuals account for the lion’s share of productivity.iv
Below are some examples.v Right away we can see that objective measures provide a different perspective on what performance may look like in a team.
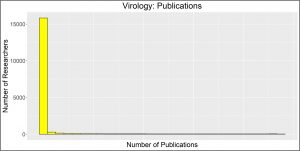
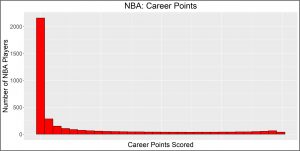
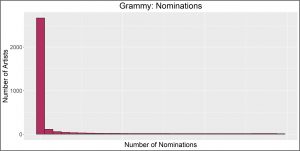
Whether we are considering the number of publications by virologists, the points scored during an NBA player’s career, or the number of Grammy nominations an artist receives, some consistent themes emerge:
- First, most people within these settings have very low levels of objective performance (i.e., the large uptick on the left-hand side of the graph). For example, there are many virologists who publish very few peer-reviewed publications. Likewise, many NBA players score very few points over the course of the career and most professional musicians will never receive a Grammy nomination.
- Instead, much of the productivity in these settings comes from a small number of star performers (i.e., the right-hand side of the figures). For example, in the NBA, the average player ends his career with 2,670 points whereas the top 10 scorers of all time average 32,500 points in their careers. That means a star performer in the NBA will score as many points as 13 average players combined (nearly an entire roster!).
- These patterns of star performance diverge from how we typically rate performance. For example, in one call center, the top sales representative generated $572.06/hour. If performance resembled those subjective ratings from earlier, the likelihood of observing such a high level of performance would be 1 in 30,562 individuals (i.e., nearly impossible).
Aligning Star Performers with the Team
Because star performers are so productive, leaders may be tempted to orient their efforts and attention towards these individuals (e.g., how to develop them, how to retain them).vi Any sports fan knows how much time coaches and managers often devote at press conferences to their stars. However, unless team members work independently (i.e., team members do their jobs entirely by themselves), then there’s also a bigger picture to consider. That is, leaders should ensure that star performers are aligned within the broader team.
Below are some questions to consider, as well as some recommendations, to help ensure that stars are an asset to your team rather than a liability.
Identifying Star Performers
- Do you know who your stars are? In the absence of objective performance measures, it may be difficult to determine who’s accounting for the most productivity within your team. Thus, if possible, creating objective measures that closely align with the objectives of the team or department would be a useful place to start when trying to get the most out of your star performers. During this process, it’s helpful to ensure that one is not creating metrics that are easy to assess but are only loosely related to the goals of the team.vii If objective performance measures are not feasible, you may consider using some type of relative performance measure (e.g., individuals recognized as high potentials, those who are in the top quartile of the performance distribution).viii
- How diverse are your star performers? Being recognized as a star performer often comes with benefits (e.g., additional development opportunities, more recognition, more rewards). Thus, it is critical to assess whether the stars in your team come represent a range of diverse backgrounds and what barriers may be in place to such diversity. For example, past research has found that star researchers are more likely to be men. Within various fields, the percentage of women who are in the top 1% of performers ranged from 6.3% to 26.2% (far below the percentage in the broader field).ix These findings do not suggest that women are poorer researchers. Instead, it indicates that there may be structures in place that hinder their exceptional performance relative to men (e.g., less recognition for the same accomplishments, inequitable access to resources). By actively assessing the diversity of star performers and removing such barriers, it is possible to open additional pathways by which stars can emerge within one’s team.
Embedding Stars within the Team’s Structure
- How many stars do you have in your team? Placing more and more stars within the same team should yield exceptional performance. However, recent research suggests that having too many stars within the same team can lead to diminishing returns.x More specifically, once a team’s roster consists of more than 20% – 30% of star employees (e.g., 2/10), the benefits for team performance begin to diminish. So, when possible, it would be preferable to distribute star employees throughout the organization and within different teams.
- How well is the rest of the team functioning? In “The Last Dance”, the recent documentary series about the Chicago Bulls during the championships in the 1990s, Michael Jordan states, “Whenever they speak Michael Jordan, they should speak Scottie Pippen.” This quote epitomizes the paradox of stars within teams. Stars, by definition, are the most productive members of the group. However, without a strong supporting cast, the benefits of the star’s productivity on the rest of the team can be quite limited. In fact, chances of an actor being nominated for an Academy award increases significantly if they work on films with costars, directors, and writers who, themselves, have been previously nominated.xi Thus, even if a leader is fortunate enough to have a star within their team, they must also ensure that other pieces of high performing teams are in place.
- Where are stars situated within your team’s workflow? Because of their out-sized effect on the amount of productivity, star performers would ideally be situated at the center of the team’s workflow (i.e., contributing to core processes, involved in critical assignments, providing input on important tasks). Past research has found that by placing stars in these positions, teams can obtain even higher levels of performance.xii
Think Broadly about “Star Performance”
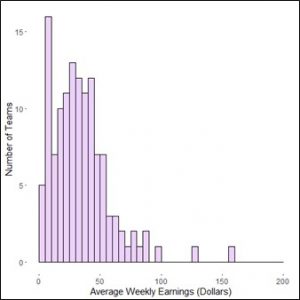
- Where are your star teams? Up until now, we’ve focused on individual employees as star performers. However, within an organization, there are also likely star performing teams.xiii That is, there are likely groups who account for an exceptional amount of productivity relative to other groups. As an example, consider the figure below. This data comes from an earlier project at a company that measured the weekly revenue generated by its teams. The large majority of teams at this firm earn, on average, less than $35 per week. However, there are a handful of teams that earn more than $80 per week (i.e., nearly twice the average). Thus, to the extent that a company relies extensively on teams, there may be value in shifting one’s attention from stars employees to star teams.
- Do you have any blackholes? Stars are primarily defined by their outsized effects on performance and productivity. However, it is also quite possible that there are individuals within organizations who exert exceptionally negative effects within organizations.xiv One recent, and striking, example comes from the field of law enforcement. The Washington Post recently analyzed data on payouts from municipalities to resolve lawsuits and claims of wrongdoing involving their police officers (40,000 payments from 25 cities totaling more than $3.2 billion). Within this data, most officers appear once or twice (7,643). However, there are some officers who are involved in 10 or more payments (239 officers), 20 or more payments (25 officers), and even 100 or more payments (5 officers). Thus, as much as teams and leaders should be actively considering how stars fit within the rest of the group, they should also be devoting efforts to addressing those individuals that are blackholes and who are having an outsized, negative effect within the organization.
Concluding Thoughts
Teams are often brought together to reach objectives and attain goals that individuals couldn’t reach on their own. By carefully considering where productivity emerges from within the group, opportunities arise for helping the team become even more effective. In particular, identifying star performers, as well as carefully considering how these individuals fit within the broader team context, can help the entire group thrive and take its performance to the next level.
i Steiner I. 1972. Group processes and productivity. Academic Press: New York.
ii Woehr, D. J., & Huffcut, A. H. (1994). Rater training for performance appraisal: A quantitative review. Journal of Occupational and Organizational Psychology, 67, 189-205.
iii Call, M. L., Nyberg, A. J., & Thatcher, S. M. B. (2015). Stargazing: An integrative conceptual review, theoretical reconciliation, and extension for star employee research. Journal of Applied Psychology, 100(3), 623-640.
iv Aguinis, H., O’Boyle, E., Gonzalez-Mule, E., & Joo, H. (2016). Cumulative advantage: Conductors and insulators of heavy-tailed productivity distributions and productivity stars. Personnel Psychology, 69, 3-66.
v These figures were derived from data reported in Aguinis et al. (2016).
vi Call et al. (2015).
vii Kerr, S. (1995). On the folly of rewarding A while hoping for B. Academy of Management Executive, 9(1), 7-14.
viii Call, M. L., Campbell, E. M., Dunford, B. B., Boswell, W. R., & Boss, R. W. (2020). Shining with the stars? Unearthing how group star proportion shapes non-star performance. Personnel Psychology, 74(3), 543-572.
ix Aguinis, H., Ji, Y. H., & Joo, H. (2018). Gender productivity gap among star performers in STEM and other scientific fields. Journal of Applied Psychology, 103(12), 1283-1306.
x Call et al. (2020); Szatmari, B. (in press). Young stars and red giants: The moderating effect of age diversity on the relationship between the proportion of high performers and team performance. Journal of Applied Psychology. doi:https://doi.org/10.1037/apl0000971.
xi Rossman, G. B., Esparaza, N., & Bonacich, P. (2010). I’d like to thank the academy, team spillovers, and network centrality. American Sociological Review, 75(1), 31-51.
xii Li, N., Zhao, H. H., Walter, S. L., Zhang, X.-a., & Yu, J. (2015). Achieving more with less: Extra milers’ behavioral influences in teams. Journal of Applied Psychology, 100(4), 1025-1039.
xiii Bradley, K. J. (2017). On the abundance of star teams: Investigating the drivers of heavy tails in team productivity distributions. (Doctor of Philosophy), Indiana University, Bloomington, Indiana.
xiv Labianca, G., & Brass, D. J. (2006). Exploring the social ledger: Negative relationships and negative asymmetry in social networks in organizations. Academy of Management Review, 31(3), 596-614.
