
By: Andy Loignon
In today’s organizations, work is now synonymous with teamwork.¹ Whether employees are working on an assembly line, are designing the next innovative product, or are saving lives in hospitals, there’s a good chance they rely on teammates to get their job done.
In helping teams maximize their effectiveness, coaches, OD practitioners, and researchers (like myself) often use survey-based assessments. That is, we ask employees to reflect on their experience in their team and complete a series of closed-response questions. Ultimately, this informs potential interventions or opportunities for development.
An Example: Relationship Conflict in Teams
A classic example of a measure used to improve team effectiveness focuses on relationship conflict. That is, how much team members experience interpersonal discord with one another.²
Example questions include:
· “How much relationship tension is there in your work group?”
· “How often do people get angry while working in your group?”
· “How much emotional conflict is there in your work group?”
When answering these questions, team members are often presented with the following response format:
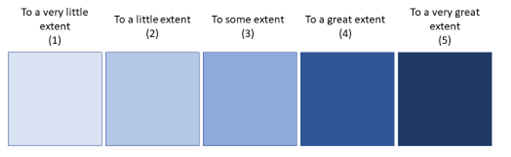
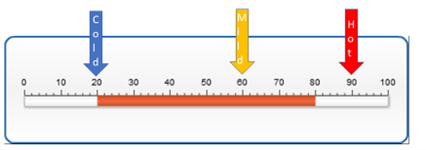
Are Team Surveys Thermometers?
Despite being ubiquitous and seemingly intuitive, surveys like the one above can cause some interpretative headaches. Most notably, there is a tendency to interpret this type of survey like a thermometer. When we use thermometers, we glance at the specific temperature and make some straightforward conclusions:
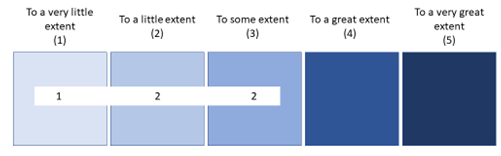
If we apply this same perspective to the measure of relationship conflict in teams, it is tempting to conclude that the absolute value is paramount. So, a team whose members report, on average, a score of 2.2 seems to have little to worry about. After all, this average score would fall somewhere between “to a little extent” and “to some extent.” Visually, a team could get an average score of 2.2 with ratings that look something like this:
Insights from a Benchmarks Perspective
Unfortunately, there are a couple critical ways in which relationship conflict does not function like temperature.
First, interpersonal conflict is relatively rare. If you consider the upper range of the survey’s response format (“To a great extent” or “To a very great extent”) many of us would be hard pressed to think of a team where personality clashes merited such a rating. Of course you would have no problem giving a 4 or a 5 rating if you happened to recently work in one of Gordon Ramsay’s high-conflict kitchens.
Second, even if people are experiencing such high interpersonal conflict, they may be less inclined to report these experiences. That is, even in teams with visible, non-ignorable personality clashes, it may be too much for a team member to actually click a 4 or a 5 and indicate such a high degree of relationship conflict. In fact, team members are often reluctant to confront these types of personality clashes and instead may actively avoid relationship conflict in their team.³ This is understandable given that such conversation likely require a substantial degree of psychological safety (i.e., minimal perceived risk among team members) and there may be consequences for directly voicing such concerns (e.g., retaliation).
 Because conflict is rarely extreme and can often be avoided, it means that a thermometer is a poor metaphor for assessing relationship conflict. Instead, a more apt metaphor might be “benchmarks.” With benchmarks, a craftsperson can mark the different lengths of two pieces of material on their workstation. Even though these markings may not tell us the precise length of the materials, they can certainly tell us which is longer. So, rather than an absolute measure (like a thermometer), a benchmarks perspective puts more emphasis on normative or relative comparisons (i.e., how do measures compare with one another).
With this benchmark perspective in mind, let’s reconsider the team whose members, on average, reported a score of 2.2. Although this score suggests that the team is experiencing conflict “to a little extent” it may still signal team issues or challenges when compared to a benchmark. Compared to a recent survey of 278 senior leadership teams at the Center for Creative Leadership (CCL), a score of 2.2 on relationship conflict would equal or exceed 85% of the groups in our sample. So, from a benchmark perspective, it’s harder to dismiss a score of 2.2. Instead, relationship conflict may need to be a topic of conversation for the team (e.g., Why are two team members providing ratings of 3? Has the team had some difficult conversations recently?) that merits future monitoring. 4
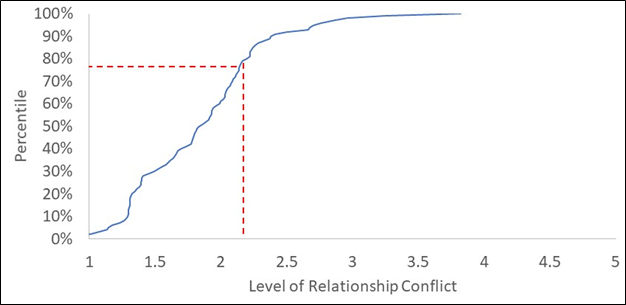
We can also compare the level of this team’s relationship conflict against what is typically observed in teams’ research. Across 73 separate studies, representing more than 1,000 teams,5 a score of 2.2 exceeds 75% of the conflict levels typically reported (see red dashed line in accompanying figure). This figure also highlights my earlier point: It’s rare to have teams experience, or at least openly report, relationship conflict to “a great” or “very great extent” (i.e., ratings 4 or 5).
To be clear, even with a limited range of relationship conflict scores, we can still predict big effects using these survey measures. For example, the typical correlation between relationship conflict and team satisfaction, across 26 separate studies and 1,900 teams, is -.54.6 Not surprisingly, team satisfaction is higher when relationship conflict is lower.
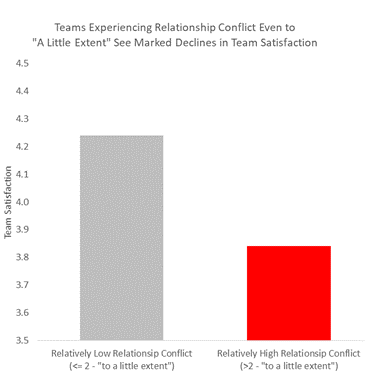
Note. The y-axis corresponds to the typical range of team satisfaction scores across 65% of teams (+1 standard deviation to -1 standard deviation).
This association between team satisfaction and relationship conflict would be considered quite strong compared to others typically found in the literature 7 and has direct implications for the ultimate effectiveness of a team.8
Limitations with the Benchmarks Perspective
Although this benchmark perspective provides some useful insights, and may even be easier to understand, this approach to assessing teams has its own shortcomings.
- First, who you’re benchmarking your team against matters. The type of work that a team does, the industry in which it works, or the prevailing cultural norms may make interpersonal conflict more or less common.9 For instance, gladiators tend to have higher levels of conflict than mediators.
- Second, relative benchmarks can be volatile. For example, if a team loses one or two members, the amount of conflict may shift substantially. Thus, benchmarks should be interpreted with care (i.e., “in context”) and considered in conjunction with other sources of information (e.g., additional measures, qualitative experiences of team members, team performance).
Practical Benefits of Applying a Benchmarks Perspective
To fully leverage this approach, while also addressing its shortcomings, we’re pursuing several strategies at CCL. First, we’re considering several ways to develop robust normative data for teams. For example, we are developing ways to integrate data from prior teams’ research into some of our existing assessments. This information can be tremendously helpful in facilitating a more accurate understanding of how a team is performing relative to comparable groups. Ideally, this would help coaches and clients more easily identify pressing areas for improvement and build upon existing strengths.
Second, we are also considering how a benchmark perspective can be useful for a range of team processes and experiences. For instance, psychological safety has been identified as a key predictor of team effectiveness.10 However, we suspect that the same issues discussed here regarding relationship conflict also pertain to surveys for assessing psychological safety. That is, few team members are going to strongly disagree with the following statement, “It is safe to take a risk on this team”.11 This then raises the possibility that few teams have exceptionally low scores on psychological safety, and instead it would be more informative to adopt a benchmarking perspective. By adopting this perspective for other, critical constructs, we can ideally provide even more impactful feedback for our clients.
Finally, we’re also working on ways to incorporate a benchmarks perspective into the visualizations we use with our clients. For example, we can make a few minor revisions to the relationship conflict survey and use color coding in a way that better depicts when team members’ interpersonal discord may be of most concern.
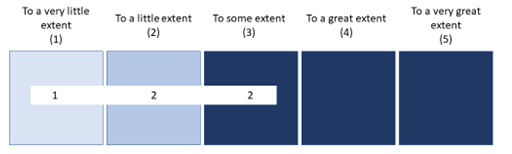
This version of the instrument makes the benchmarking perspective much clearer by highlighting when relationship conflict may actually become an issue of concern for teams. Ideally, this will help a team better understand how it stacks up against other groups.
Concluding Thoughts
It’s natural to wonder how we measure up against others. We often look for relative information to make sense of ambiguous or unclear data. For example, an annual salary of $50,000 means something very different if you learn your peer is earning $200,000 versus hearing they make $45,000. The same is true for teams and the assessments available to facilitate their development. Along with knowing if a team scores high or low (in an absolute sense), there can be tremendous value in considering how the group’s experience compares to similar teams.
1 Hollenbeck, J. R., Beersma, B., & Schouten, M. E. (2012). Beyond team types and taxonomies: A dimensional scaling conceptualization for team description. Academy of Management Review, 37(1), 82-106.
2 Jehn, K. A. (1995). A multimethod examination of the benefits and detriments of intragroup conflict. Administrative Science Quarterly, 40, 265-282.
3 De Dreu, C., & Van Vianen, A. E. M. (2001). Managing relationship conflict and the effectiveness of organizational teams. Journal of Organizational Behavior, 22(3), 309-328.
4 Jehn, K. A., & Mannix, E. A. (2001). The dynamic nature of conflict: A longitudinal study of intragroup conflict and group performance. Academy of Management Journal, 44(2), 238-251.
5 de Wit, F. R. C., Greer, L. L., & Jehn, K. A. (2012). The paradox of intragroup conflict: A meta-analysis. Journal of Applied Psychology, 97(2), 360-390.
6 de Wit, F. R. C., Greer, L. L., & Jehn, K. A. (2012). The paradox of intragroup conflict: A meta-analysis. Journal of Applied Psychology, 97(2), 360-390.
7 Bosco, F. A., Aguinis, H., Singh, K., Field, J. G., & Pierce, C. A. (2015). Correlational effect size benchmarks. Journal of Applied Psychology, 100(2), 431-449.
8 Hackman, J. R. (1987). The design of work teams. In J. W. Lorsch (Ed.), Handbook of organizational behavior. (pp. 315-342). Englewood Cliffs, NJ: Prentice Hall.
9 Wildman, J. L., Thayer, A. L., Rosen, M. A., Salas, E., Mathieu, J. E., & Rayne, S. R. (2012). Task types and team-level attributes: Synthesis of team classification literature. Human Resource Development Review, 11(1), 97-129.
10 Rozovsky, J. (2015). The five keys to a successful Google team. re:Work. Retrieved from https://rework.withgoogle.com/blog/five-keys-to-a-successful-google-team/
11 Edmondson, A. (1999). Psychological safety and learning behavior in work teams. Administrative Science Quarterly, 44, 350-383.
