
By: Sol Bukin and Michelle Schneider
Have you ever completed a survey at the end of a program and wondered if anyone was really going to look at it? Your skepticism might actually be warranted. In today’s growing movement toward big data and digital transformation, it may come as a surprise that a recent global survey showed that more than half of data collected by companies goes unused.1 Often because businesses lack the capacity, tools, and skills necessary to conduct useful analyses. This is particularly true when trying to analyze large amounts of qualitative data, such as thousands of text responses from valuable customers open-ended questions.
Our organization’s mission is to provide transformative leadership development experiences, and one way we fulfill this mission is by listening to program participants share what is most valuable to them, and adapting our programs and delivery methods to stay relevant and applicable. We tap into participant experience through our end-of-program surveys, but, over time, the number of responses can build up and become difficult to synthesize. Leaving this valuable information unexamined is not an option for us and can compromise our work toward our mission.
So, what’s the best approach to take with analyzing significant volumes of text?
You could hire someone to hand-code every response by theme, which would likely take hundreds of hours (and dollars!), producing results too slowly to make improvements in real time. Alternatively, you could have a data scientist with advanced skills in machine learning create a complex algorithm that analyzes your data, which is costly, and likely may still require some human coding.
Or you can adopt a strategy similar to the one we use at the Center for Creative Leadership (CCL) that has enabled us to listen to tens of thousands of customers (participants as we call them) by combining evaluation methods2 with innovative text-analysis technologies.
As an organization that provides leadership development experiences to tens of thousands of individuals a year and promises “results that matter,” our evaluation team found ourselves unable to keep up with the manual coding of open-ended participant responses to our end-of-program evaluations. With the advancement of machine learning3 and the growth of web-based tools to automate and process large volumes of text, we determined that using a web-based text processing platform would help us ensure we were still listening to our participants, even at high volumes. The platform we use, TextIQ by Qualtrics , uses natural language processing to analyze text and automatically tag participant comments by topic every time a participant responds and monitors those topics over time. However, there are many text analysis tools that function similarly on the market.
Below we present our 7-step approach to leveraging web-based text-analysis for evaluative purposes. Along with our steps, we share an example of what we were trying to learn at CCL in real time with assistance from this new technology, what emerged, and how we used the data.
The Challenge:
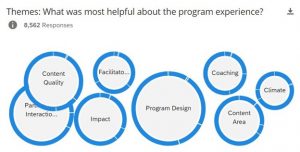
We know that participants generate meaningful connections in our programs4 and that these connections are a valuable part of the program experience. With the pandemic-driven shift to more virtual delivery we had gathered data that showed that we were still generating meaningful connections, but we wanted to understand more about those connections through our open-ended data. We turned to one of our standard open-ended questions — “What was most helpful about your program experience?” — to see if connections emerged as a theme. While that data is normally reviewed at a program level, we wanted a broader view across all our programs and thousands of participants.
The Solution: Our 7-Step Approach to Keeping our Finger on the Pulse of Thousands of Participants
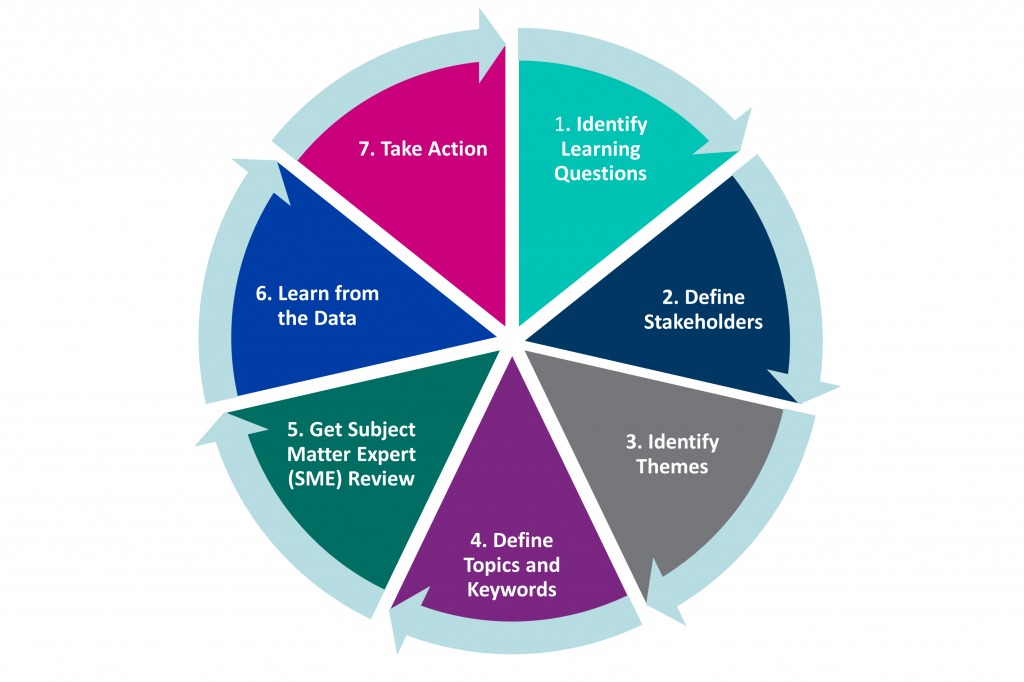
1. Identify the Learning Question
What is it that you want to learn from your customers that will help you improve the product or services that you offer? Do you have to draft a learning question from scratch to capture this, or perhaps you already ask this question in a standard survey? In CCL’s case, connecting with one another has always been an important aspect of the CCL program experience. In fact, 94% of participants say yes when asked if they have meaningful connections with others during our programs. However, we wanted to know if participants discussed these connections as a top theme when asked what was most helpful about their program experience, especially now that most of our programs are virtual. If so, how were participants connecting, what enabled these connections, and did participants find them valuable? If so, why?
2. Define Stakeholders
Who might benefit from listening to customer responses? How might they use this data to make decisions or take action? In our case, our stakeholders include facilitators who design and deliver programs, business partners who help us sell our programs, and clients who want to understand their return on investment.
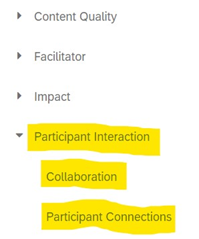
3. Identify Themes
To make sense out of thousands of open-ended responses, it’s best to sort them into categories. There are several approaches you could take to develop an initial list of topics or themes, from machine learning tools that suggest topics based on your data to reading through the comments and manually documenting recurring themes.
At CCL, we started with a list of topics that had been developed manually in the past. We wanted our topic library to be user-friendly for our stakeholders, so we thought about the types of topics by which they might want to sort comments. We kept our learning questions in mind, such as whether participants are connecting virtually and how, and made sure our library enabled us to answer them. It’s also valuable to do some industry research in this stage and make sure you’re naming your topics using shared language that is common in your industry, organization, and with your clients.
4. Define Topics and Keywords
Make sure each topic is unique and does not overlap with another topic. For example, “Collaboration” & “Sharing Ideas” might be similar enough to merge into one topic. Documenting a description of each topic is helpful to avoid confusion on what belongs in that topic. To avoid overwhelming stakeholders with too many topics, make sure each one is valuable and has enough comments that will be tagged into it. For example, if only 7 out of 10,000 responses are tagged into a topic, consider deleting or merging it with another category. To capture the comments that you want tagged in a topic, you’ll need to come up with keywords or phrases. Below are some of the keywords that we use to capture participant connections:
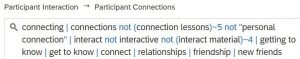
Once you have applied your keywords for the software to automatically tag comments, it’s helpful to read through the comments that haven’t been tagged and add words you might have missed. It’s likely that some of your keywords will capture comments that do not belong. For example, when we included the word “Connections” we realized it was capturing comments about making a personal connection to the lessons. Maintaining a topic library that accurately tags comments is a journey of reviewing and refining the keywords.
5. SME Review
Once the vast majority of your comments have been tagged into a category, you have a first draft of your topic library. There are likely others in your organization that have more knowledge on certain topics on which your customers are giving you feedback. In our case as evaluators who are not in the classroom, it made sense for us to ask for review and feedback from faculty and others who design our content and know firsthand how participants interact with each other during programs. Having subject matter experts (SMEs) review the topics that are relevant to their roles is a great way to improve the validity of your topic library.
6. Learn from the Data
Once you have a functional topic library, it’s time to learn from the data. What topics are mentioned most often? Less often? Why might that be? Do the qualitative data support quantitative data, or is it telling a different story?
If you recall, we knew based on a quantitative item in our standard surveys that 94% of participants agreed that they were able to meaningfully connect with others. However, beyond knowing that people are connecting with one another, this number didn’t tell us much else. Going back to our learning questions, we wanted to know if participants were mentioning those connections in their open-response feedback. If they were, was there any indication of how people were connecting, if they found those connections valuable and if so, why?
Using our topic library, we looked at the responses to the question, “What was most helpful about your program experience?” to gain more context. Out of the 10,900 comments that have been tagged into a topic from a sample of global leaders who attended either virtual or face-to-face leadership programs, more than one-third (33%) of comments mention that participants found interacting with other leaders the most helpful part of their program experience. Although this might not seem like a huge number, it is the 2nd largest theme that emerged after “Program Design.” This suggests that participants are mentioning those connections in their open-response feedback, and are indeed finding it valuable to connect with others during leadership development programs.
To find out more about how our customers are connecting and why they find it valuable, it’s important to take time to read what they have to say. Below are some examples of responses that mentioned connecting with others:
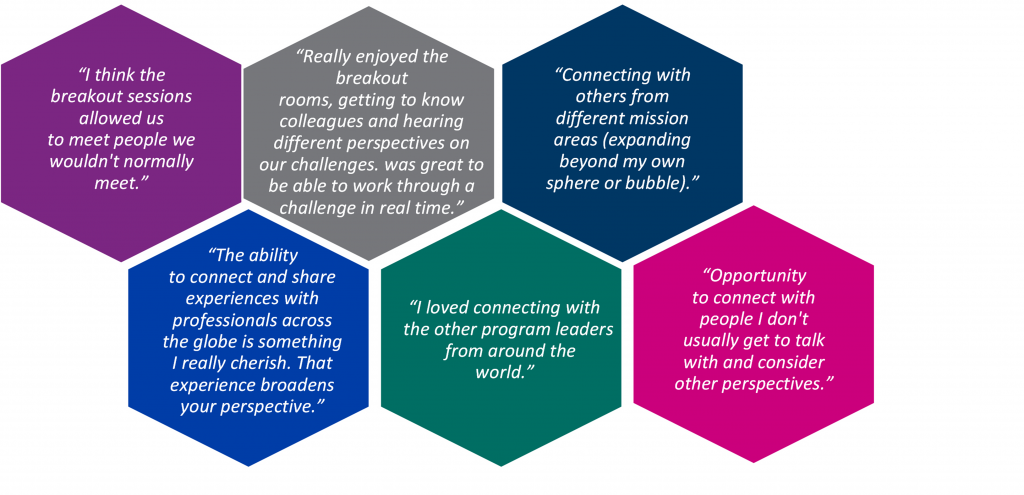 While reading through the comments, it becomes clear that many leaders share similar experiences while going through a CCL program with others. It seems that breaking people up into smaller groups is a great way for meaningful connections to form. It also seems that a valuable part of connecting with people in a leadership development experience is that you interact with people who you wouldn’t typically work with or meet in your daily life. If other participants are from the same organization, this can help break down silos. If participants are from different organizations, it’s a great chance to expand their network. Either way, participants are reporting that connecting with others in this way broadens their perspective.
7. Share Insights to Enable Action
Once you have taken the time to learn from what your customers are saying, it’s important to share those insights with your stakeholders so that they can take action. In our case, we have shared the following insights with our facilitators and instructional designers:
- Continue to prioritize time in small groups
- Avoid putting participants who likely already know each other in the same small group
- When communicating with clients, highlight that leadership development programs can be a way to break down silos, expand one’s network, and broaden a leader’s perspective. These could be outcomes that the client might not think are linked to leadership development programs
How you make these insights accessible to your stakeholders is also important. Communicating findings with your stakeholders in a digestible way empowers them to link insights to their role and the broader strategy of the organization. Since we use a Qualtrics tool for our text analysis, we link a widget to a Qualtrics dashboard for our stakeholders to access results in real time.
Conclusion
Now more than ever, centering the voice of our customers is critical to the success of all of our organizations.5 We know that leadership development experiences that are relevant, applicable, and meaningful will help participants improve their leadership practices. Listening to the voices of our participants around what is most helpful and improving our programs through that information is central to achieving our mission. Our approach of combining evaluation methods with online text analysis tools has helped us hear from more participants without compromising our ability to learn from their qualitative feedback. It has deepened our understanding about our participant experiences and helped us uncover insights that might not have otherwise been identified had we only looked at numeric data.
References
1. The State of Dark Data: A Global Research Survey of 1,300+ Business and IT Decision Makers Across Seven Leading Economies (2019). Splunk. https://www.splunk.com/pdfs/dark-data/the-state-of-dark-data-report.pdf
2. Wholey, J. S., Hatry, H. P., & Newcomer, K. E. (2010). Handbook of practical program evaluation (Vol. 19). John Wiley & Sons.
3. Otter, D. W., Medina, J. R., & Kalita, J. K. (2020). A survey of the usages of deep learning for natural language processing. IEEE Transactions on Neural Networks and Learning Systems, 32(2), 604-624.
4. Stawiski, S. (2021). Meaningful Connections Among Leaders in Virtual Settings, Center for Creative Leadership, https://cclinnovation.org/news-posts/meaningful-connections-among-leaders-in-virtual-settings/.
5. Schneider, M. & Hamill, J. (2020). Practicing what we teach: Early lessons in listening to and learning from participants leads to program effectiveness, Center for Creative Leadership, https://cclinnovation.org/news-posts/practicing-what-we-teach-early-lessons-in-listening-to-and-learning-from-participants-leads-to-program-effectiveness/.
